

SENSORS FOR WATER TRANSPARENCY CONTROL IN OPTICAL AND MICROWAVE BANDS
- Optical method.
Transparency is one of the main characteristics in distinguishing the quality of water. The monitoring of transparency or turbidity of water is based on the measuring of coefficient of propagation and dispersion of light inside the water sample in optical and microwave band on several wave lengths.
As the dimness of water is usually accompanied by the change of it’s color (from bluish to yellow), therefore it is expedient to use sensors with a few different wavelengths.
Fig. 1.2 shows the layout of the water transparency meter on 5 wave-lengths: optical (650nm - Red, 550nm - Green, 450nm - Blue) and infrared (850nm and 940nm) ranges [1]. It uses 5 emitters operating at different wavelengths and a broadband receiver. Measurements of attenuation at different wavelengths are carried out by one channel receiver, sequentially in time. To improve electromagnetic susceptibility against external light sources, low-frequency modulation of the signal combined with the narrowband synchronous reception of the electromagnetic beam transmitted through the sample is being utilized. The integrated sensor block diagram is shown in Fig.1, a general exterior view of the sensor unit in which the test tube with the water sample is placed inside of the emitter and receiver casing is shown in Fig.2. The spectral sensitivity of the broadband photo-receiver (opt101) is shown in Fig.3. In Fig 4 you see the different plotted wavelengths used to transmit through the sample. In the emitting device groups (are the different impulses combined or related to each other – or is the emission independent in each light diode?) of impulses are consistently produced by 5 light-emitting-diode sources with a different wave-length of the signal (sources from 1 to 5 from left to right).
In the emitting device groups (are the different impulses combined or related to each other – or is the emission independent in each light diode?) of impulses are consistently produced by 5 light-emitting-diode sources with a different wave-length of the signal (sources from 1 to 5 from left to right).
The receiver for the reflected signal is a photodetector (opt101). After amplification of the signal by the photodetector, the resulting response is input to the 12 bit ADC, which is part of the microcontroller. The microcontroller demodulates the emitted signal, therefore a digital synchronous signal is received by the receiver. After the digital filtering, the resulting information is displayed on the screen showing the signal strength of each of the sources (from 1 to 5 from left to right, top to bottom). Due to the use of modulation the signal is not affected by the ambient illumination. The filtering improves signal / noise ratio, and the 32 times multiple oversampling improves the efficiency of the 14-bit ADC (Analog Digital Controller), which increases the dynamic range of the system. This device allows you to explore the transmission, scattering and reflection coefficients of media at several wavelengths in the optical wavelength range.
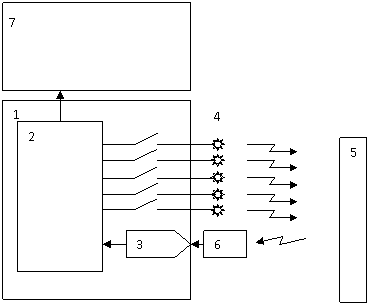 Fig.1. Flow diagram: 1 is a microcontrol-ler, 2 is arithmetic – logics unit (ALU) of micro-controller, 3 is ADC of microcontroller, 4 are emitters (light-emitting diodes LED), 5 is the investigated object, 6 is a photodetector , 7 is a display.
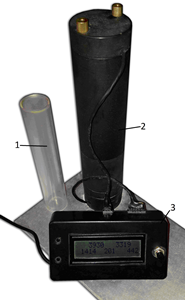 Fig. 2. General view of multivalve meas-uring device of transparency of water : 1 –measurement cuvette; 2 is a block for a cuvette with emitters and receiver; 3 is a display
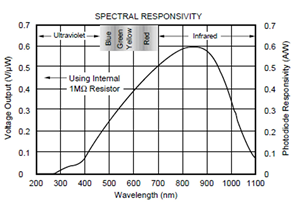 Fig 3. Spectral sensitivity of receiver of multi wave sensor
The dynamic range of measurements of the luminous flux attenuation ranges up to 30 dB, which allows to control the transparency (turbidity) of water in a wide range. Using the multi-wavelength mode allows you to increase the selectivity and accuracy of measurements and to differentiate the size of the dust. The evaluation results of the optical transparency of the water sample are shown in Fig. 4-5.
The correlation between the attenuation of the optical signal with the degree of contamination of ground water is shown in Fig. 4. Fig. 5 shows the optical appearance with different contaminations [2]. To control the transparency, we use a standard method of estimation of resolution similar to what is used in television. It should be noted that in a sufficiently wide range of contaminants (from 0 to 80%) the attenuation vs the degree of contamination satisfactorily is described by a linear relationship. Accuracy evaluation of the level of contamination by this method does not exceed 2%, which is quite acceptable in the practice of using it for water quality control.
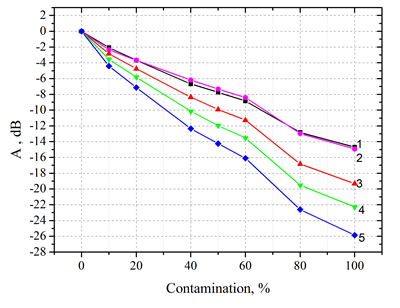
Fig. 4. Contamination vs the attenuation of the detected signal for different wave-lengths in the optical and IR ranges:1-940nm, 2-850nm, 3 - red, 4 - green, 5 - blue. 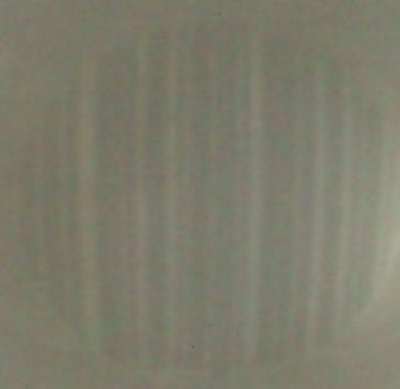
Contamination 50% 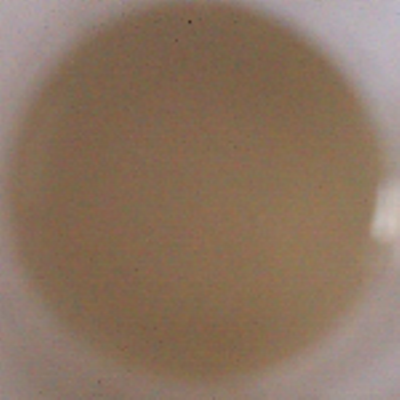
Contamination 100% Fig.5. Optical transparency of water of brown color. Studies have shown that the use of measurements at several frequencies in the optical wavelength range would be a solution to manufacture sensors for monitoring of water with high sensitivity to pollution at low cost.
- Measurements in mm wavelength range.
The presence of contaminants in water affects its dielectric properties. This property change can be measured through the methods of SHF (Super high frequency) and EHF (Extremely high frequency) dielectrometry. Therefore the use of this highly sensitive measurement method within a capillary-waveguide using resonance phenomena allows to detect the presence of micro-impurities (trace-elements) in water with concentrations as low as 0,1% [3], and, as the last research results showed, it allows the identification of water from different natural sources.
The cell of the dielectrometer consists of a capillary-waveguide resonator based on a rectangular waveguide with a transection of 3,6mm x1,8 mm and a dielectric PTFE capillary with an outer diameter = 1.5 mm and an inner diameter of = 1.1 mm passing through the widest wall of the waveguide (Fig .6, 7). It measures the magnitude of attenuation at different frequencies occurring during resonance. By using reference polarization attenuator within the measuring section it is possible to reduce the measurement error to the level of 0,5 dB. The measurement error of the resonance frequency and bandwidth does not exceed 0,1 GHz. Because of resonances occurring in the multilayers inside of the capillary with the liquid under investigation, the system is sufficiently sensitive to trace contaminants.
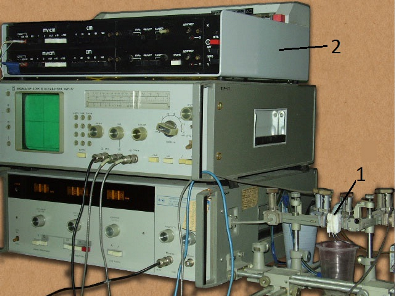
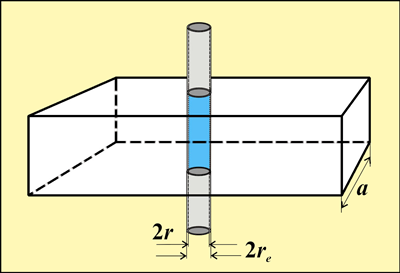
Fig. 6 – Laboratory unit for determination of characteristics of liquids by the method of capillary-waveguide resonance: 1 is capillary-waveguide reso-nator, 2 is a general view of the lab setting based on the panoramic EHF- meter of Р2-69 type. Fig.7 The capillary-waveguide reso-nator.
The advantages and capabilities of the method are shown in Fig. 8, 9. Showing the correlation between the frequency of resonance and the occurring attenuation depending on the alcohol concentration in the aqueous solution (Fig. 8), and its influence on the quality factor of the resonance absorption shown on Fig. 9.
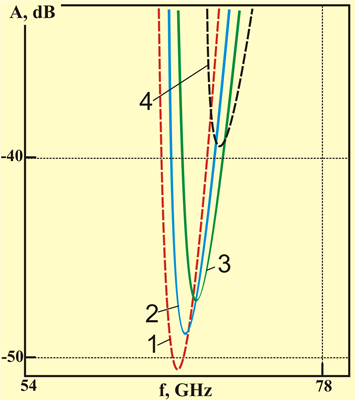
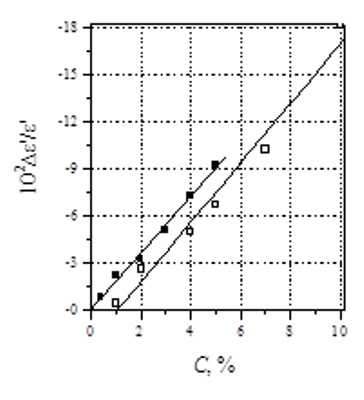
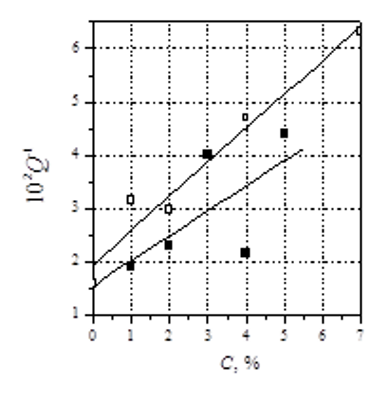
Fig.8 Descriptions of reso-nant absorption of water solutions of alcohol : 1 is a distillate;2 - dis-tillate + 1% of alcohol; 3 is a dis-tillate + of 2% alcohol; 4 is a dis-tillate + of 4% alcohol. а) b) Fig. 9 Correlation between changes of inductivity (а) and good quality of resonance of absorption (b) on the concentration of alcohol in the solution .
It is evident that the amount of alcohol in water with concentrations of a few percent is reliably recorded by this method. Maximal sensitivity of the method on concentration is about 0.2%. The observed resonant absorption, for water and aqueous solutions, is between frequencies of 63 - 66 GHz.
As an example, Fig. 10 shows the correlation between the frequency and the attenuation for several water samples. The highest magnitude of attenuation in the resonance curve by the absorption of electromagnetic energy was observed for the double distillate at ~ 43 dB (curve 1), for one flash distillate it decreased to 41 dB (curve 2) and for the artesian water at 37 dB (curve 3).
Resonance absorption curves for different types of water- distilled water, melted and tap water are shown in Fig. 11.
It can be seen that the distillate is characterized by the most distinctive resonance absorption. Thus the resonance frequency, the magnitude of absorption and the quality factor can serve as parameters for distinguishing the purity of drinking water. Development of specialized measuring machines, instead of the universal, which were used in laboratory experiments can significantly reduce the size of the sensor and its power consumption. The transition from the millimeter wavelenght range to decimeter waves can significantly increase the size of the measuring capillary and simplify the design of the sensor, but requires further development.
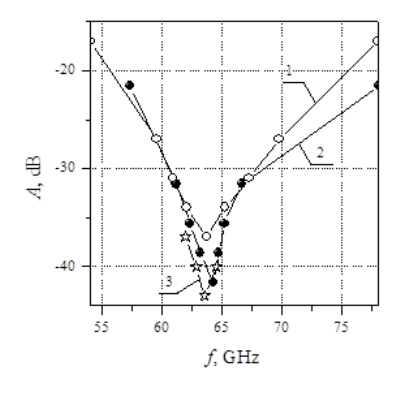
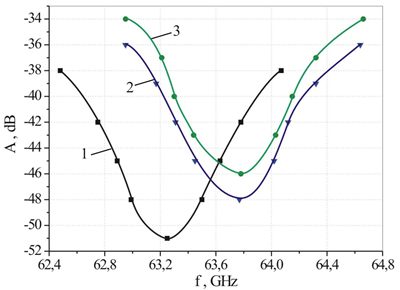
Fig. 10 . Descriptions of resonant absorption of different types of water : 3 - water 721; 2 is a distillate; 1 is a bi-distillate Fig. 11. Descriptions of resonant ab-sorption of different types of water : ■- 1- distillate; ◄- 2 is the melted snow; ●- 3 is a tap water. Structurally, the optical sensor with a receiver and several emitters (optical and IR ranges) are located on the opposite side of the pipe with a diameter of about 20 mm-. 25 mm and a length of 50 cm, through which the water which has to be tested, flows. The radio wave sensor uses a pipe having a diameter about 5mm-.6mm and a length of the testing area around 50...60mm through which the water under diagnoses flows. The sensors are very flexible integrated in the monitoring flow of water, either directly or by a bypass circuit (outlet which gets a sample flow arranged parallel to the main flow channel).
Keywords: optical sensor, light attenuation in the medium, the optical transparency, capillary-waveguide resonator, dielectric characteristics, Q-factor and depths of the resonance absorption.
References
- 1. The multi-wavelength sensor to control the transparency of water in the optical range / Е.V. Krivenko, V.I. Lutsenko, I.V.Popov, Liu Yao / International Scientific and Technical Conference Radioengineering fields, signals, devices and systems: Conference Proceeding March 16 – 22, 2015 Kyiv, Ukraine – Р.100-102
- Smart Grid Technology is The Basis of Modernization of Water Supply System for The Future Sustainable Development of Society/ V.F. Kravchenko, O.V. Krivenko, S.A. Levchenko, and V.I. Lutsenko/ Physical Bases of Instrumentation. – 2015. – V. 4. № 1. – Р.12-29
- А.s. № 1307315 USSR, МКI G01 N 22/00 Cell fore measuring of a pa-rameters of liquid dielectrics / E.V. Belyakov, A.M. Hrapko (USSR), print. 1987, Iss. № 16.